Transmission-Connected Generation

Transmission-connected generation refers to facilities that are connected to the high-voltage IESO-Controlled Grid, which include all lines over 50 kilovolts (kV), such as 115 kV, 230 kV, and 500 kV transmission lines. The low-voltage grid is operated by local distribution companies.

Real-time Supply Output

The current hourly output by fuel type reported on the homepage and the Power Data page represents the production values of transmission-connected generation. This real-time data comes from the hourly Generator Output and Capability report, that provides output levels from generators, registered as market participants, with capacities of 20 megawatts (MW) or greater.

Distribution-connected generation (also known as embedded generation) is not reported through the Generator Output and Capability report. More information can be found in the distribution-connected generation section.

Current Installed Capacity

Ontario’s supply mix has significantly changed over the last decade—wind, solar, bioenergy, waterpower, refurbished nuclear and natural gas-fired resources have replaced Ontario’s coal fleet. The current Reliability Outlook reports that Ontario's installed (transmission-connected) generation capacity totals 38,193 MW. The amount of generation actually available from day-to-day is dependent on current conditions, including facility outages (planned maintenance or unplanned).
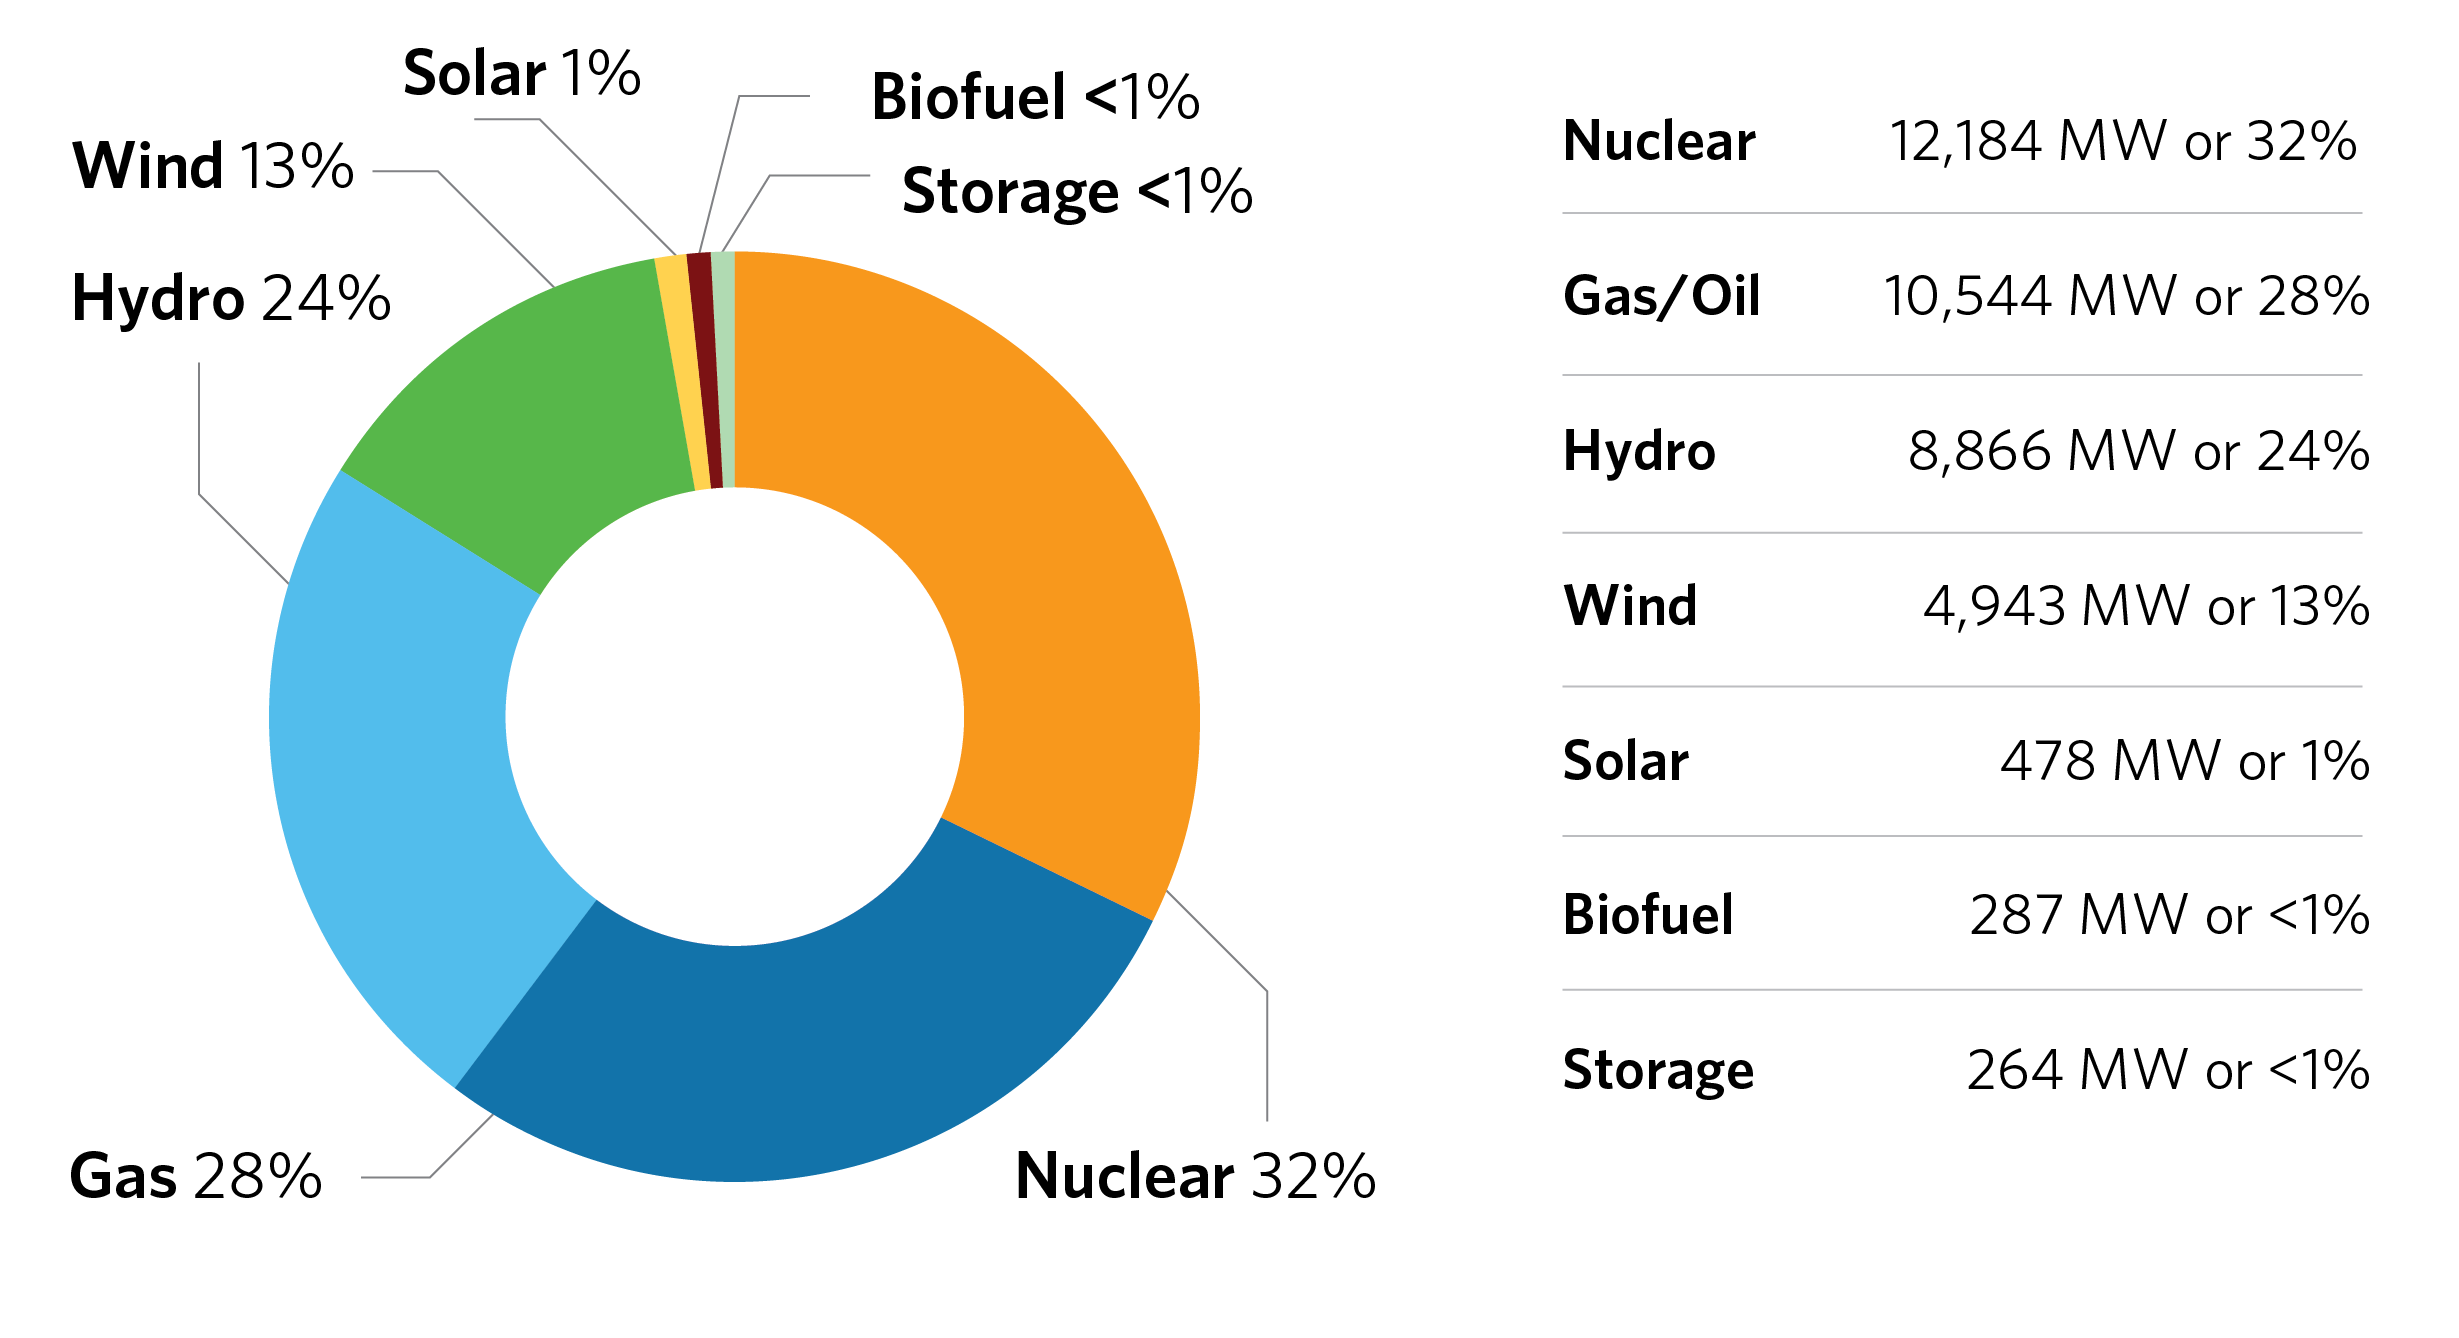
Ontario's current installed generation capacity includes*:

*Note that these figures do not include generators that operate within local distribution service, except for those that participate in the IESO-administered market. Most solar facilities in Ontario are currently connected to the distribution system. 

Source: Reliability Outlook, released March 21, 2024 updated quarterly.

Monthly Energy Output by Fuel Type

The Generator Output by Fuel Type Monthly report contains monthly values of total output, grouped by fuel type. It includes facilities as reported through the real-time supply output above, as well as facilities with installed capacity of less than 20 MW that are transmission-connected. This report does not include embedded generation. More information on embedded generation can be found in the distribution-connected generation section.

Yearly Energy Output by Fuel Type

The graph and figures below report the yearly 2022 output by fuel type. It includes facilities as reported through the real-time supply output above, as well as facilities with installed capacity of less than 20 MW that are transmission-connected. These figures do not include embedded generation. More information on embedded generation can be found in the distribution-connected generation section.

Donut chart displaying energy output by source for 2023
Year Nuclear Hydro Gas/Oil Wind Biofuel Solar

2022

78.8 TWh

53.7%

38.0 TWh

25.9%

15.2 TWh

10.4%

13.8 TWh

9.4%

0.3 TWh

<1%

0.75 TWh

<1%

2021

83.0 TWh

58.2%

34.2 TWh

24%

12.2 TWh

8.6%

12 TWh

8.4%

0.4 TWh

<1%

0.75 TWh

<1%

2020

87.8 TWh

60%

36.9 TWh

25%

9.7 TWh

7%

11.8 TWh

8%

0.4 TWh

<1%

0.8 TWh

<1%

2019

90.4 TWh

61%

36.4 TWh

25%

9.5 TWh

6%

 11.0 TWh

7%

 0.4 TWh

<1%

0.7 TWh

<1%

2018

90.1  TWh

61%

36.2 TWh

25%

9.6 TWh

6%

10.7 TWh

7%

0.4 TWh

<1%

0.6 TWh

<1%

2017

90.6 TWh

63%

37.7 TWh

26%

5.9 TWh

4%

9.2 TWh

6%

0.4 TWh

<1%

0.5 TWh

<1%

2016

91.7 TWh

61%

35.7 TWh

24%

12.7 TWh

9%

9.3 TWh

6%

0.49 TWh

<1%

0.46 TWh

<1%

Percentages may not add up to 100 due to rounding.

See the Year-End Data page for historical energy output by fuel type.

Contracted Electricity Supply on the Transmission Grid

The quarterly Progress Report on Contracted Electricity Supply provides a status of the IESO’s contracted generation capacity in both the Ontario transmission and distribution grids.

This data may differ from the current supply mix, which describes all grid-connected generation that has completed the market entry process and a small amount of embedded generation that participates in the IESO-administered market.

The status of contracted electricity supply in Ontario can be found on the Contract Data and Reports web page.

IESO Active Generation Contract List

The IESO Active Generation Contract List provides the status of individual contracted electricity supply projects within different IESO procurement programs. The list is limited to generation facilities under contract to the IESO. More information on the contract list can be found on the Contract Data and Reports web page.

Generation Renewal

Ontario's electricity sector is going through a process of renewal — with the replacement of aging infrastructure and the transition to a more sustainable energy supply mix. Here’s a list of new generation scheduled to come in service within the next 18 months. Also included below is an overview of new and refurbished generation projects of 20 MW or more that have been commissioned, as well as units that have been retired since 2002.

Source data: Reliability Outlook

Committed Generation Resources

2025 Q2
 Decorative icon representing storage Oneida Storage 235 MW

New and Retired Generation Since the IESO Market Opened in May 2002

2023
Decorative icon representing wind
Romney Wind Energy Centre
60 MW
Decorative icon representing hydro
Beck 1 New G1 59 MW
Decorative icon representing hydro
Beck 1 New G2 59 MW
2022
Decorative icon representing wind
Nation Rise 100 MW
2021

Calstock -38 MW
 Decorative icon representing wind energy Henvey Inlet Wind Farm 300 MW
2020
 Solar Icon Loyalist Solar 54 MW
 Gas/Oil Icon Napanee Generating Station 985 MW
2019
Solar Icon  Nanticoke Solar 44 MW
Yellow Falls Generating Station  16 MW
2018
Wind Icon  Amherst Island Wind 74 MW 
Wind Icon   North Kent Wind 1 99.1 MW 
Wind Icon  Belle River Wind 100 MW
Hydro Icon   Namewaminikan Hydro 10 MW
 Biomass Icon Thunder Bay Generating Station  -153 MW
 Biomass Icon  Fort Frances Unit  -47 MW
2017
 Wind Icon Niagara Region Wind Farm  230 MW
 Hydro Icon  Peter Sutherland Senior Generating Station  29 MW
Solar Icon  South Gate Solar  50 MW
Solar Icon  Windsor Solar  50 MW
Gas/Oil Icon  Greenfield South (Green Electron Power)  334 MW
Wind Icon Bow Lake Phase 1 and 2b 60 MW

2016
Wind Icon Grand Bend Wind Farm (Zurich) 99 MW
Solar Icon Northland Power Solar Empire 10 MW
Solar Icon Northland Power Solar Abitibi 10 MW
Solar Icon Northland Power Solar Martin's Meadow 10 MW
Solar Icon Northland Power Solar Long Lake 10 MW
Wind Icon Grand Valley Wind Farms (Phase 3) 40 MW
Wind Icon Armow Wind 180 MW
Wind Icon Cedar Point Wind Power Project Phase II 100 MW
2015
Biomass Icon Thunder Bay Unit Converted to Burn Biomass 153 MW
Solar Icon Grand Renewable Energy Park (Grand SF) 100 MW
Wind Icon Jericho Wind Energy Centre 150 MW
Wind Icon  Adelaide Wind Power (Landon) 40 MW
Wind Icon Dufferin Wind Power (Shannon) 91.3 MW
Wind Icon Goshen Wind Energy Center 102 MW
Wind Icon Grand Renewable Energy Park (Grand WF) 149 MW
Wind Icon Goulais Wind Farm 25 MW
Wind Icon K2 Wind Project 270 MW
Wind Icon  Bornish Wind Energy Centre 74 MW
Wind Icon Adelaide Wind Energy Centre 60 MW
Nuclear Icon  Nuclear Upgrade at the Bruce Power Plant 31 MW
Solar Icon Kingston Solar Project 100 MW
Biofuel Icon  Thunder Bay Condensing Turbine Project 40 MW
Hydro Icon Old Smoky Falls Units -53 MW
2014
Hydro Icon Three new hydraulic units at Smoky Falls 264 MW
Hydro Icon Third hydraulic unit at Kipling Generating Station 79 MW
Wind Icon  Erieau Wind 99 MW
Wind Icon Port Dover and Nanticoke Wind Project 105 MW
Hydro Icon  Third Unit at Little Long 67 MW
Solar Icon Liskeard 1,3 and 4 30 MW
Coal Icon Thunder Bay Units 2 and 3 -306 MW
Hydro Icon  New Third Unit at Harmon 78 MW
Wind Icon South Kent Wind (Railbed) 270 MW
Wind Icon McLean's Mountain Wind Farm 60 MW
Wind Icon Bluewater Wind Energy Centre (Blake) 60 MW
Wind Icon  East Lake St. Clair 99 MW
Wind Icon   Summerhaven Wind Energy Centre 125 MW
Biomass Icon  Atikokan Converted to burn Biomass  
2013
Wind Icon Comber Wind 166 MW
Wind Icon Pointe Aux Roches Wind Farm (Paroches) 49 MW
Coal Icon Lambton Coal Shutdown -1,016 MW
Coal Icon  Nanticoke Coal Shutdown -1,985 MW
2012
Coal Icon  Atikokan Unit Shutdown -211 MW
Nuclear Icon  Bruce Units 1 and 2 1,552 MW
Gas/Oil Icon York Energy Centre 438 MW
2011
Wind Icon  Greenwich Wind Farm 99 MW
Wind Icon Gosfield Wind 50 MW
Wind Icon Raleigh Wind Energy Centre (Dillon) 78 MW
Coal Icon  Nanticoke Units 1 and 2 shutdown -980 MW
2010
Gas/Oil Icon Thorold cogeneration 287 MW
Gas/Oil Icon Halton Hills Generating Station 705 MW
Coal Icon  Nanticoke and Lambton unit shutdowns -1,950 MW
Biomass Icon Conversion of Fort Frances to biofuel 47 MW
Wind Icon  Talbot Wind Farm (Spence) 99 MW
Wind Icon Kruger Energy Chatham Wind (Portalma T3) 101 MW
2009
Gas/Oil Icon  St. Claire Energy Centre 678 MW
Gas/Oil Icon  Portlands Energy Centre (Combined Cycle) 246 MW
Gas/Oil Icon  Goreway Station 942 MW
Hydro Icon   Beck Unit 7 conversion 69 MW
Hydro Icon  Beck 2 upgrades 68 MW
Wind Icon   Enbridge Ontario Wind Farm (Underwood) 182 MW
Wind Icon  Wolfe Island Wind Farm 198 MW
Gas/Oil Icon   East Windsor Cogeneration 100 MW
2008
Gas/Oil Icon  Portlands Energy Centre (Simple Cycle) 394 MW
Gas/Oil Icon  Greenfield Energy Centre 1,153 MW
Hydro Icon   Umbata Falls 24 MW
Wind Icon Kruger Energy Port Alma (T1) Wind Project (Portalma T1) 101 MW
Wind Icon Melancthon II (Amaranth) 132 MW
2007
Hydro Icon   Abitibi Canyon (Upgrades) 20 MW
Wind Icon   Ripley Wind 76 MW
2006
Gas/Oil Icon   Greater Toronto Airport Authority 117 MW
Wind Icon   Melancthon Wind (Amaranth) 68 MW
Wind Icon   Kingsbridge 40 MW
Wind Icon  Erie Shores Wind Farm (Port Burwell) 99 MW
Wind Icon  Prince Wind 99 MW
Wind Icon  Prince II Wind 90 MW
2005
Nuclear Icon  Pickering Unit 1  515 MW
Coal Icon  Lakeview (Retirement)  -1,130 MW
2004
Nuclear Icon  Bruce Unit 3 782 MW
Gas/Oil Icon Brighton Beach 580 MW
Gas/Oil Icon Kirkland Lake 32 MW
Hydro Icon  Beck and Kipling (Upgrades) 80 MW
2003
Nuclear Icon Pickering Unit 4 515 MW
Nuclear Icon Bruce Unit 4 770 MW

Note:

An asterisk (*) denotes the project has achieved commercial operation  but has not met all the commissioning requirements of the IESO.

Some facilities have been combined in name (resulting in an increase in capacity) or have changed their name from when being first registered into the system. The list above is the original record when they first commissioned onto the system. The Generator Output and Capability Report includes a list of all facilities over 20 MW and their current output connected to the IESO-controlled grid.

Nuclear Power Generating Stations

Nuclear power represents approximately 13,000 MW or over 30 percent of Ontario's installed generation capacity. Ontario's three nuclear facilities typically produce about 60 percent of the province's electricity.

Read more about Ontario's nuclear power generating stations.

Site

Bruce

Darlington

Pickering

Location

Kincardine

Clarington

Pickering

Installed Capacity

6,300 MW

3,500 MW

3,100 MW

Number of Units

8

4

6

Operator

Bruce Power

Ontario Power Generation

Ontario Power Generation

Refurbishment and Continued Operations Schedule

Two units (1 & 2) were refurbished and brought back into service in 2012. The IESO signed an agreement with Bruce Power in December 2015, securing 6,300 MW of electricity and enabling the refurbishment of the remaining six units, beginning in 2020.

OPG started the refurbishment of the first unit at the Darlington station in October 2016. Darlington refurbishment is scheduled for completion by 2026.

Two units will be retired at the end of 2022 and four units will be retired at the end of 2024.

Cost Recovery

Generation contract with IESO.

More information is available on the Energy Procurement and Contracts Archive web page.

Regulated rates set by Ontario Energy Board.

Regulated rates set by Ontario Energy Board