2018
A clean and diverse resource mix continued to provide reliable power in Ontario while energy efficiency programs, embedded generation and demand response participation helped ensure the electricity needs of Ontarians were met in 2018. Ontario’s demand for electricity over the course of the year returned to the flat trend observed over the last 10 years, after a deviation in 2017, caused by mild and wet weather resulting in lower demand.
Looking ahead, the electricity system has sufficient resources to maintain reliability in Ontario through 2019, but there is a potential need for new electricity supply in the coming years. A new, long-term forecast released by the IESO at the Technical Planning Conference in fall 2018 showed that Ontario is emerging from a capacity surplus and there is a potential need for additional supply as early as 2023. Recognizing our changing needs, fundamental changes to the electricity market are underway through the Market Renewal Program. This program will improve and strengthen the structure of the existing market, and move Ontario toward a more innovative and competitive auction to acquire the electricity needs of tomorrow at the lowest cost to consumers. This project is expected to deliver $3.4 billion in savings over a 10-year period. Learn how the IESO is designing the electricity market of tomorrow and join the conversations that are shaping it.
Demand
Total energy demand in 2018 was 137.4 terawatt-hours (TWh), a 5.3 TWh or four percent increase from demand levels in 2017, but in line with demand levels observed in 2016 and 2015 and back to the flat trend observed since the 2008 recession. The demand peak of the year was 23,240 megawatts (MW), reached on September 5 during a prolonged period of unseasonably high temperatures. This peak was reduced by embedded solar generation and large industrial consumers reducing their consumption, through the Industrial Conservation Initiative (ICI). This was the third consecutive year the annual demand peak occurred in the month of September. This trend is attributed to warm weather lingering into the early fall months, at the same time that embedded solar output is decreasing due to shorter and less intense daylight hours.
On a daily basis, the IESO continues to see flattened demand peaks, resulting from the combined impact of consumer response to price incentives, such as the ICI, and generation from embedded resources – especially solar – that offsets demand on the transmission grid. The rapid growth of these embedded generation resources over the last few years has largely plateaued. At year-end, there were more than 4,100 MW of distributed energy resources (DERs) in the province. This number includes embedded generation that is contracted or under development and aggregated demand response (DR) procured through the DR auction.
Supply
In 2018, more than 93 percent of electricity generated in Ontario came from non-greenhouse gas emitting* resources (nuclear, hydro, wind and solar). Nuclear power continued to be a substantial form of generation for the province; 35 percent of installed capacity on the transmission system, and representing 61 percent of the energy produced in 2018.
Hot summer weather drove up supply from gas generation by about 3.7 TWh. As a resource used to meet peak demands and provide operational flexibility, gas output in July and August grew to help maintain reliability during periods of increased consumer demand for electricity and support long-term nuclear refurbishment.
Changes to Ontario’s installed generation in 2018 included the addition of 273 MW of wind, and the removal of 200 MW of biofuel and 8 MW of hydroelectric capacity from Ontario’s fleet.
*At the point of generation. Does not reflect lifecycle and upstream emissions.
2018 Transmission-Connected Generator Output
|
|
Nuclear |
Hydro |
Gas/Oil |
Wind |
Biofuel |
Solar* |
|---|---|---|---|---|---|---|
|
2018 (TWh) |
90.1 |
36.2 |
9.6 |
10.7 |
0.4 |
0.6 |
|
2018 (% of total) |
61% |
25% |
6% |
7% |
<1% |
<1% |
|
2017 (TWh) |
90.6 |
37.7 |
5.9 |
9.2 |
0.4 |
0.5 |
|
2017 (% of total) |
63% |
26% |
4% |
6% |
<1% |
<1% |
|
2016 (TWh) |
91.7 |
35.7 |
12.7 |
9.3 |
0.49 |
0.46** |
|
2016 (% of total) |
61% |
24% |
9% |
6% |
<1% |
<1% |
Represents IESO-metered generation that may be distribution connected.
Due to rounding, percentages may not add to 100.
*Most solar facilities are connected to distribution systems, not the transmission system.
**2016 values represent solar/other output.
Price
The weighted average wholesale price of electricity – the Hourly Ontario Energy Price (HOEP) – for 2018 was 2.43 cents/kilowatt-hour (kWh). The estimated 2018 Global Adjustment (GA) Class B rate as of January 17, 2019, was 9.07 cents/kWh. The total cost of power for Class B consumers, representing the combined effect of the HOEP and the GA, was 11.50 cents/kWh.
Imports/Exports
As part of a large, interconnected transmission system, imports and exports continued to support system reliability and economic efficiency; exports help to manage periods of surplus baseload generation and imports supplement local resources to help Ontario meet demand. In 2018, Ontario continued to be a net exporter, importing 8,438 GWh and exporting 18,591 GWh in 2018. This represented a 19 percent decrease in net export volumes over 2017.
Energy Efficiency
Energy efficiency is the most cost-effective resource to help meet the province’s energy needs. At about two cents per kilowatt-hour, energy efficiency leverages investment in existing assets and helps avoid investment in new, more expensive electricity infrastructure. In 2018, the IESO continued to enable energy efficiency through a combination of incentive programs, such as rebates on equipment upgrades, customer engagement, and support for training and education initiatives. This effort resulted in more than 6.2 TWh of net energy savings from programs delivered by local distribution companies and the IESO since 2015 – the equivalent of taking half a million homes off the grid for a year.
Nuclear Manoeuvres and Shutdowns Overview
Nuclear manoeuvring capability offered by Bruce Power supports system reliability by reducing the output of nuclear units by approximately 300 MW each. This capability provides valuable flexibility to the system during period of low demand where surplus baseload generation (SBG) exists, and also helps the IESO prevent nuclear shutdowns.
In 2018, there was a significant reduction in the nuclear curtailments and shutdowns due to planned nuclear outages, including refurbishments occurring during typical SBG periods, particularly the spring. As a result, there were only 115 nuclear manoeuvres in 2018, down from 511 in 2017, representing a total of 168 GWh or approximately 0.2 percent of total nuclear energy. No nuclear shutdowns were required in 2018.
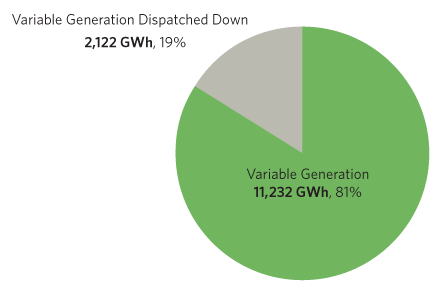
Variable Generation Dispatch
The IESO’s variable generation (VG) dispatch allows the system operator to harness the flexibility of wind and solar to help balance the electricity system. In mild weather conditions, the VG dispatch also helps avoid nuclear shutdowns during periods of surplus baseload generation (SBG). In 2018, the total amount of wind and solar energy that was dispatched down was 2,122 GWh, representing approximately 19 percent of total variable generation in 2018. This is down from 26 percent in 2017, due to planned nuclear outages that took place during typical periods of SBG.
*Note that these values include grid-connected wind and solar generation only.
Other 2018 Highlights
- The Market Renewal Program released High-Level Designs for each of the three initiatives in the energy work stream; the high-level design for the incremental capacity auction will follow in 2019.
- The capacity-based demand response program that contracted for demand response participation ended. Demand response is now fully administered through a competitive auction mechanism.
- The final cost estimate of Bruce Power’s nuclear refurbishment was forecasted to be $75.50/MWh, saving about $150 million for Ontario consumers, with any additional cost savings to be shared equally between the IESO and Bruce Power.
- A stakeholder engagement was launched to seek community and stakeholder feedback on the development of the IESO’s Innovation Roadmap, an initiative designed to enhance system reliability and drive down costs in collaboration with industry partners.
- A new Save on Energy website was launched, leveraging social media and ad campaigns to provide magazine-style consumer tips and advice, and featuring new content for small businesses, as well as a contractors and allies section to help SOE channels sell their programs to customers.
- The IESO brought together communities at two Regional Electricity Forums in Waterloo and Timmins to discuss local electricity matters and how the unique characteristics of each region can factor into the broader provincial electricity planning process.
- The IESO held the first Technical Planning Conference to discuss the planning outlook, processes and products, as well as the planned competitive transmission procurement process.
- In June, the IESO held its second annual Electricity Summit, Unlocking the Value of Innovation, which included discussions of consumer behaviour and drivers for innovation, as well as the how the electricity system will adopt to or change traditional approaches, processes and systems resulting from innovation, including blockchain technology and distributed energy resources.