2020
Fast Facts: Demand, Supply, Price
Overall electricity demand patterns in all sectors in Ontario were impacted by COVID-19 in 2020, resulting in overall electricity use decreasing by 2.1 per cent. Total electricity use was 132.2 TWh, the second lowest since 1988. While lockdowns in March and April resulted in 8-12 per cent less overall electricity use than usual for those months, Ontario’s grid continued to operate reliably throughout the pandemic, thanks to close coordination with generators, transmitters, distributors and our North American counterparts.
Despite a drop in electricity use due to stay at home measures, 2020’s hourly demand peak rose to its highest, 24,446 MW on July 9 at 6 p.m. This was the highest hourly peak since 2013 due to significant air conditioning load during a heatwave as people worked from home, along with the hiatus of the Industrial Conservation Initiative. Resources from the Demand Response Auction were activated during this heatwave, providing up to 600 MW during the peak hours of July 9 and 10.
Here’s a recap of how Ontario’s electricity system performed in 2020.
2020 |
2019 |
||
Energy Output (TWh) Notes: |
Nuclear |
87.8 (60%) |
90.4 (61%) |
|
Hydro |
36.9 (25%) |
36.4 (25%) |
|
|
Wind |
11.8 (8%) |
11.0 (7%) |
|
|
Gas/Oil |
9.7 (7%) |
9.5 (6%) |
|
|
Biofuel |
0.4 (<1%) |
0.4 (<1%) |
|
|
Solar |
0.8 (<1%) |
0.7 (<1%) |
|
Imports (GWh) |
5,178 |
6,613 |
|
Exports (GWh) |
20,377 |
19,779 |
|
Demand |
Total (TWh) |
132.2 |
135.1 |
|
Price (cents/kWh) |
Hourly Ontario Energy Price (avg. weighted) |
1.39 |
1.83 |
|
Global Adjustment |
11.82 |
10.8 |
|
|
Total Cost of Power |
13.21 |
12.63 |
|
Capacity
Grid-connected capacity in 2020 totalled 38,644 MW. This includes the addition of 54 MW of solar, and 985 MW of gas generation that reached commercial operation in 2020.
Figure 1: Grid-connected capacity as of December 2020.
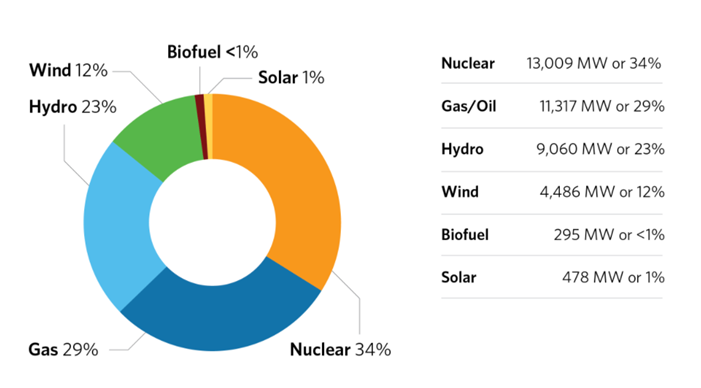
Note: Represents IESO-metered generation that may be distribution connected.
Demand Response Auction
Through the 2019 Demand Response Auction, 779.8 MW was secured for summer 2020 and 799.5 MW for winter 2020/2021. Demand Response Auction participants are consumers, or third-party organizations coordinating consumers, who are available to reduce electricity consumption when prices rise or as required to help ensure the reliability of Ontario’s electricity system.
Capacity Auctions
The Demand Response Auction was expanded in 2020 to include a broader range of eligible resources. The 2020 Capacity Auction secured 992.1 MW of capacity for summer 2021 from industrial and commercial consumers providing demand response, imports, generation and energy storage. The final Ontario-wide clearing price was $197.58/MW-day, a decrease of roughly 26 per cent from the year before. This diverse set of electricity assets will help the province manage peak summer loads.
On a local level, the IESO launched a pilot auction in York Region to procure 10 MW of capacity. Providers include residential aggregators, supermarket operators, and manufacturers providing demand response and generation. The outcomes of this auction will be used to evaluate capacity auctions as an approach to addressing local constraints.
Storage
About 54 MW of storage participate in the IESO-administered markets by providing ancillary services. They contributed roughly 13.9 GWh to the system in 2020 providing system balancing and frequency regulation. With the input of stakeholders, the IESO has released a long-term vision that will pave the way for storage to compete on a level playing field with traditional resources.
Managing Surplus Baseload Generation
Several nuclear plants were on outage this year, resulting in less surplus baseload generation (SBG). There were 97 nuclear manoeuvres, representing a total of 101 GWh or approximately 0.1 per cent of total nuclear output. The remaining SBG was managed by curtailing variable generation such as wind, and to a lesser extent, solar. A total of 2,621 GWh of variable generation was curtailed, representing 17 per cent of total variable generation.
*Note that these values include all nuclear reductions for SBG, not reductions made for other reasons (such as planned or forced outages).
Energy Efficiency Savings from Save on Energy Programs
Energy-efficiency programs support customers to reduce electricity costs as well as address future grid capacity needs. Preliminary results show Ontarians achieved 800 GWh* in energy savings through Save on Energy programs in 2020. More savings from projects approved in 2020 to come, but forecasts show the 8.7 TWh energy savings target for 2015-2020 will be achieved.
Since Save on Energy was first launched a decade ago, Ontario has achieved 16 TWh of energy savings, enough to power over 1.8 million homes for a year. More than 250,000 residential consumers and businesses have participated in an energy efficiency program.
*Note: Savings data for 2020 is preliminary and unverified. This will be updated as the number is finalized.
Stakeholder Engagement
Stakeholder engagement activities moved online, and resulted in a 40 per cent increase in participation throughout the pandemic. The launch of a new engagement format allowed stakeholders to more effectively plan their participation in engagement activities.