2021
Capacity
Grid-connected capacity in 2021 totalled 38,079 MW*. This includes the addition of 300 MW of wind generation that reached commercial operation in 2021.
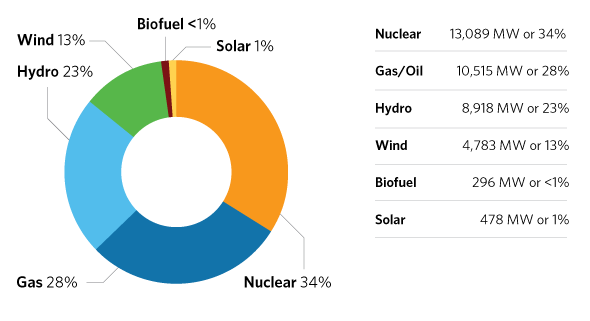
*As of December 20, 2021. The IESO has made changes in 2021 to better align the Reliability Outlook methodology with the Annual Planning Outlook, and to more accurately account for the current installed capacity of resources across Ontario. This resulted in changes to the reported capacity of nuclear, hydro, gas/oil, wind, and biofuel.
Capacity Auction
Another round of the capacity auction in 2021 secured capacity from a diverse range of resources, with 1,286.7 megawatts (MW) cleared for the 2022 summer obligation period, with another 841.9 MW cleared for the winter of 2022-2023.
The list of successful participants can be found in the news item.
Energy Efficiency Auction
Municipalities, hospitals, warehouses, industrial facilities and others participated in the first-ever energy efficiency auction that secured energy efficiency projects to reduce peak electricity demand.
The auction secured 7.4 MW of energy reductions for the daily peak hours of winter 2022/2023 and 6.6 MW for summer 2023.
For more information, visit the news release.
York Region Electricity Market Demonstration
This pilot project marked the first time in Canada DERs secured through a local capacity auction were used to help reduce local peak demand. Successful DER participants from the 2020 auction were activated during a heatwave last summer to help reduce local demand by 4.6 MW on June 7, 2021 and 3.6 MW on June 28, 2021. There were a total of nine activations in the summer of 2021.
A new round of DERs participated in year two of the local capacity auction, expanded to allow participants to provide local reserve service. A total of 15 MW of capacity was procured through the auction with a clearing price of $0.40/kW-day, lower than last year ($0.64/kW-day).
A list of the winning participants can be found on the IESO website.
Storage
About 54 MW of storage capacity participates in the IESO-administered markets mostly by providing ancillary services – but also through the capacity auction. They contributed roughly 10.9 GWh to the system in 2021 providing system balancing and frequency regulation.
Managing Baseload Generation
Several nuclear plants were on outage this year, resulting in less surplus baseload generation (SBG). There were 19 SBG-related nuclear manoeuvres, representing a total of 22 GWh or approximately 0.03 per cent of total nuclear output. Compared to the previous year where there were 97 manoeuvres representing 101 GWh or 0.1 per cent of total nuclear output.
The remaining SBG was managed by curtailing variable generation such as wind, and to a lesser extent, solar. A total of 1,289 GWh of variable generation was curtailed, representing 12 per cent of total variable generation. The previous year’s curtailment totalled 2,621 GWh, or 17 per cent of total variable generation.
Energy Efficiency Savings from Save on Energy Programs
Even as the impacts of the pandemic continued to be felt by residents and businesses across the province, Ontarians continued to reduce their energy use in 2021 by almost a terawatt hour* by implementing energy-efficient improvements through Save on Energy programs such as the Retrofit program, Small Business Lighting program, and the Energy Affordability program. The electricity saved is equivalent to powering a city the size of Oshawa for one year.
Since Save on Energy energy-efficiency programs were first launched more than a decade ago, Ontario has achieved 17 TWh of energy savings, enough to power over two million homes for a year. More than 270,000 residential electricity consumers and businesses have participated in a Save on Energy program. Ontario’s demand for electricity is expected to grow over the next 10 years and energy efficiency will play an important role in cost-effectively meeting system needs, driving cost competitiveness and promoting customer-driven solutions.
* Savings data for 2021 are preliminary and unverified. These data will be updated as the numbers are finalized.