Powering Tomorrow > Seven Graphs and a Map: 2025 Annual Planning Outlook
Grid evolution
Seven Graphs and a Map: 2025 Annual Planning Outlook
May 27, 2025 | Article
The IESO’s 2025 Annual Planning Outlookidentifies system needs and planned actions from 2026–2050 to ensure the reliability, affordability and sustainability of Ontario’s electricity system. To meet increasing demand for electricity, work is well underway to build more generation, upgrade the transmission system, integrate new technologies, and expand energy-efficiency programs.
Analysis for the outlook was completed prior to the ongoing threats of U.S. tariffs on Canadian goods, and at the time of publishing the Annual Planning Outlook, there remains significant uncertainty around Canada-U.S. trade policy and potential economic impacts. The IESO will also evaluate the impact of tariffs in future planning and procurement cycles and will consider those impacts as a part of forthcoming resource adequacy decisions.
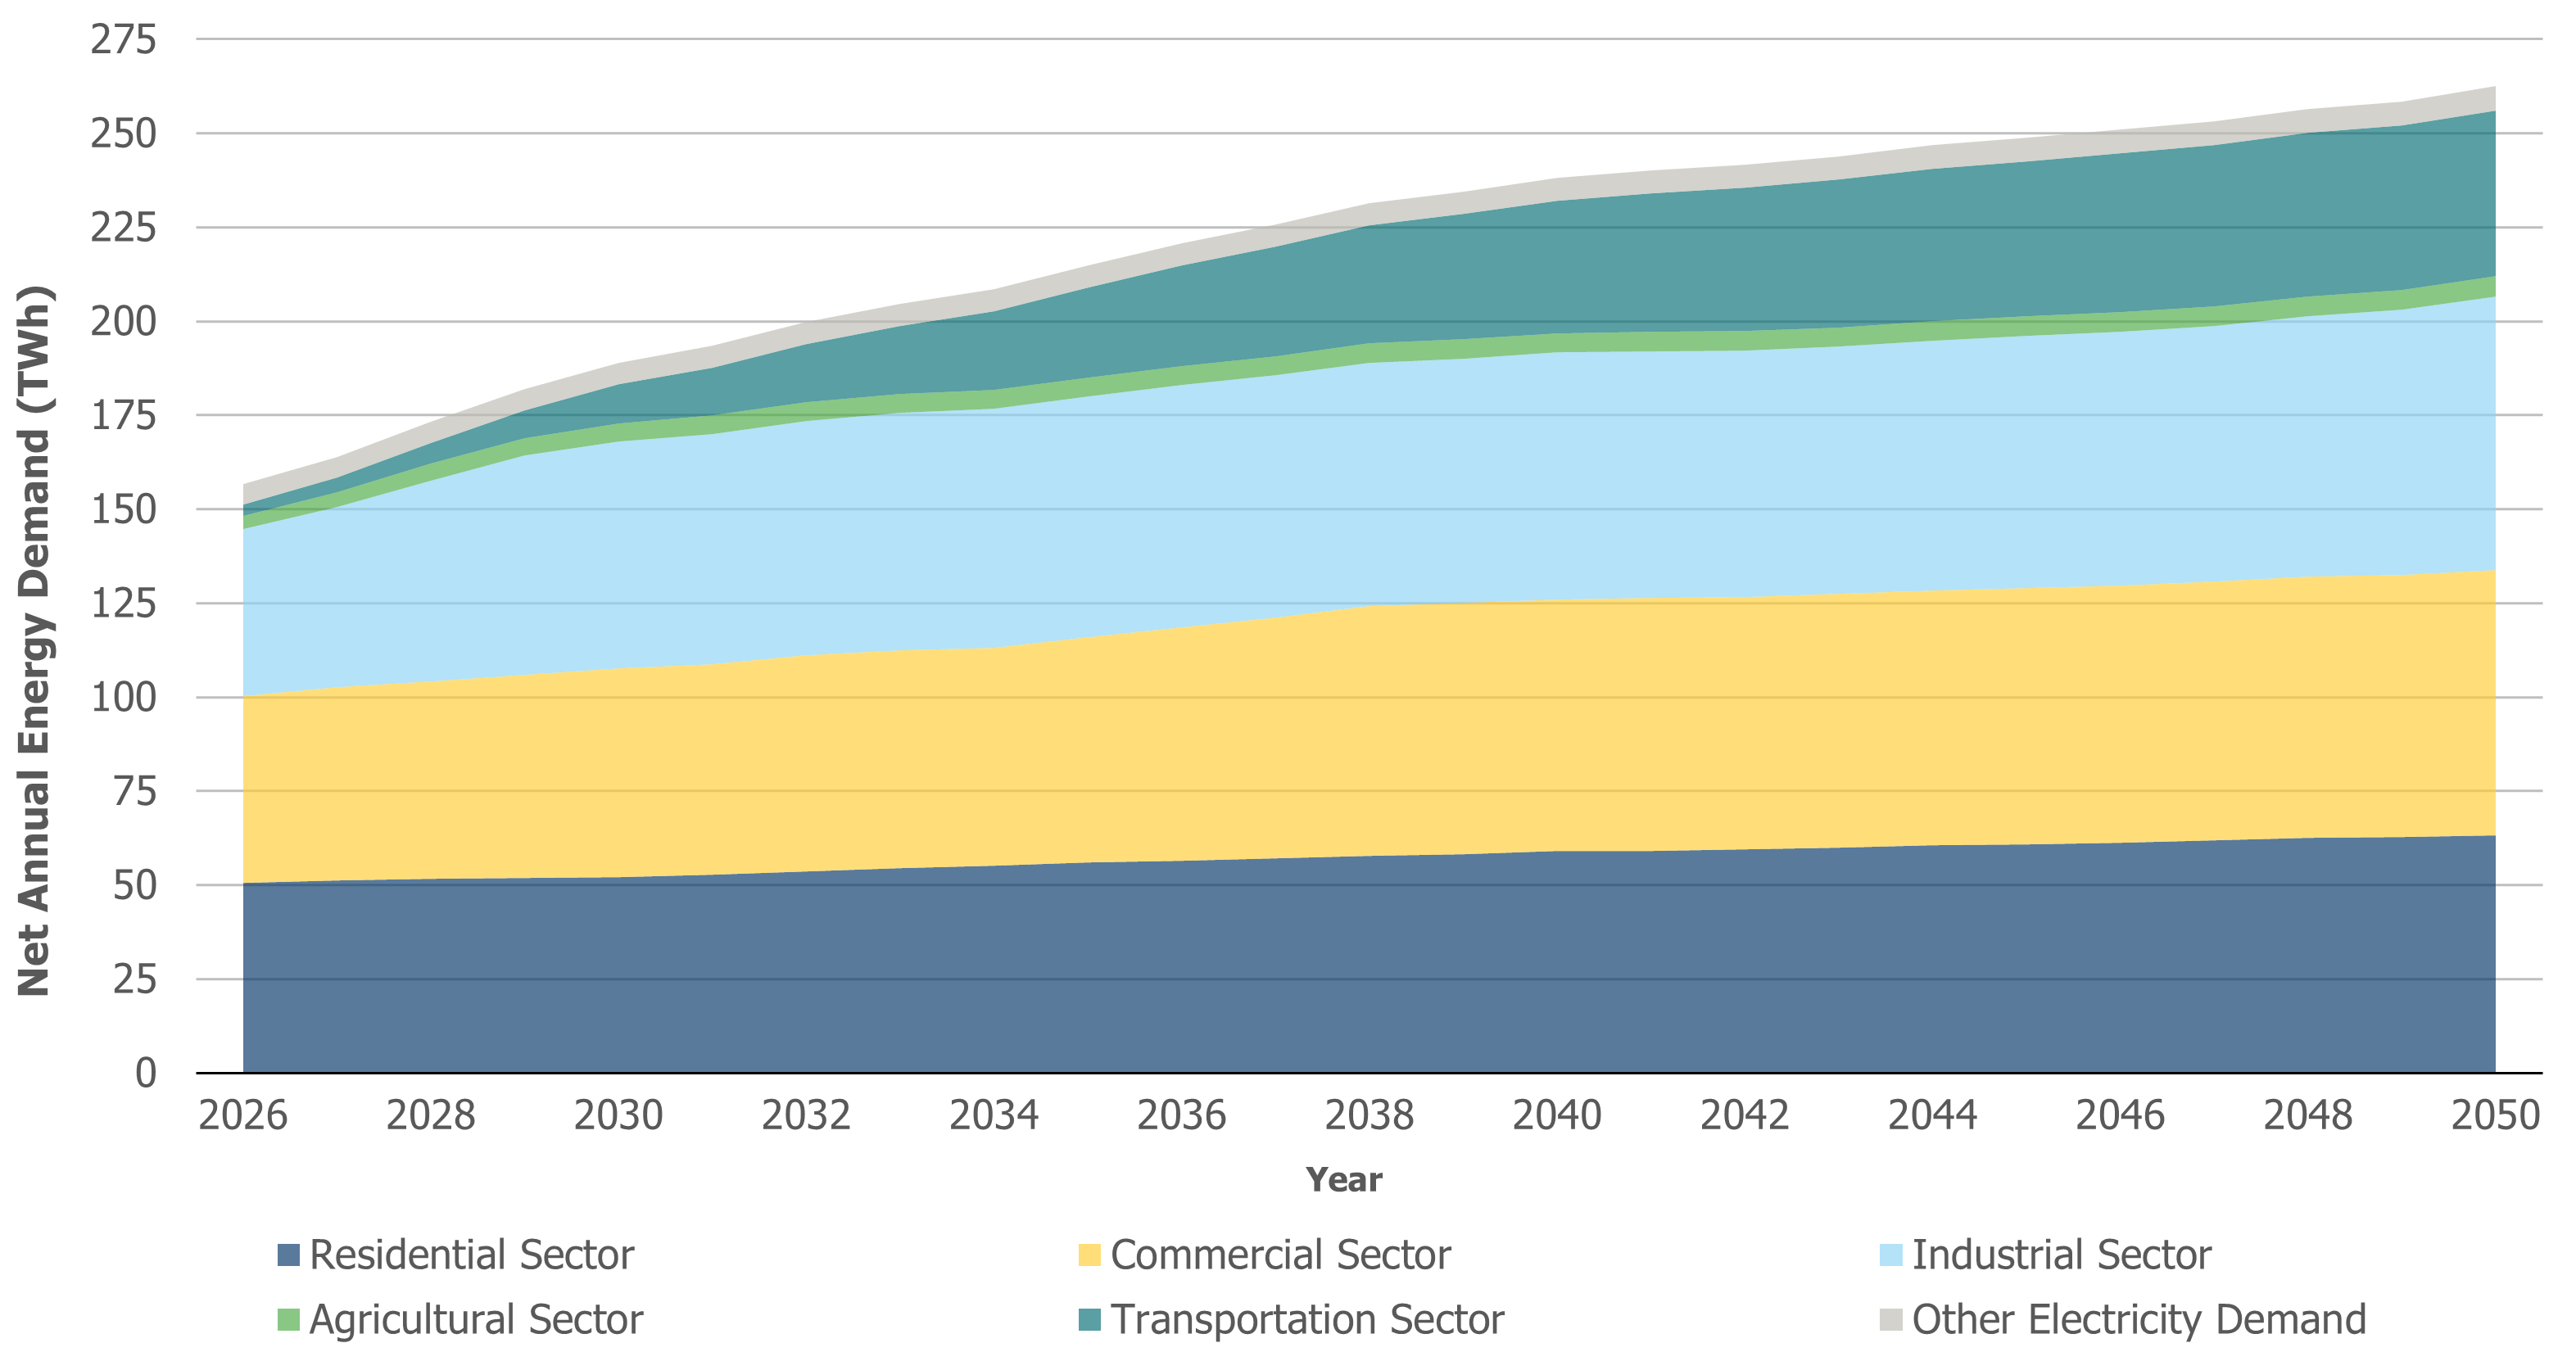
Electricity demand is forecast to rise steeply and steadily
The 2025 demand forecast anticipates that Ontario’s electricity demand will grow 75 per cent by 2050 — higher than last year’s 60 per cent forecast — with annual consumption rising from 151 terawatt-hours (TWh) in 2025 to 262 TWh in 2050.
The accelerated pace of growth in the 2025 forecast is primarily attributed to the industrial sector, which includes additional electric vehicle supply chain manufacturing and energy-intensive data centres, a trend that is quickly emerging around the world to support the proliferation of artificial intelligence.
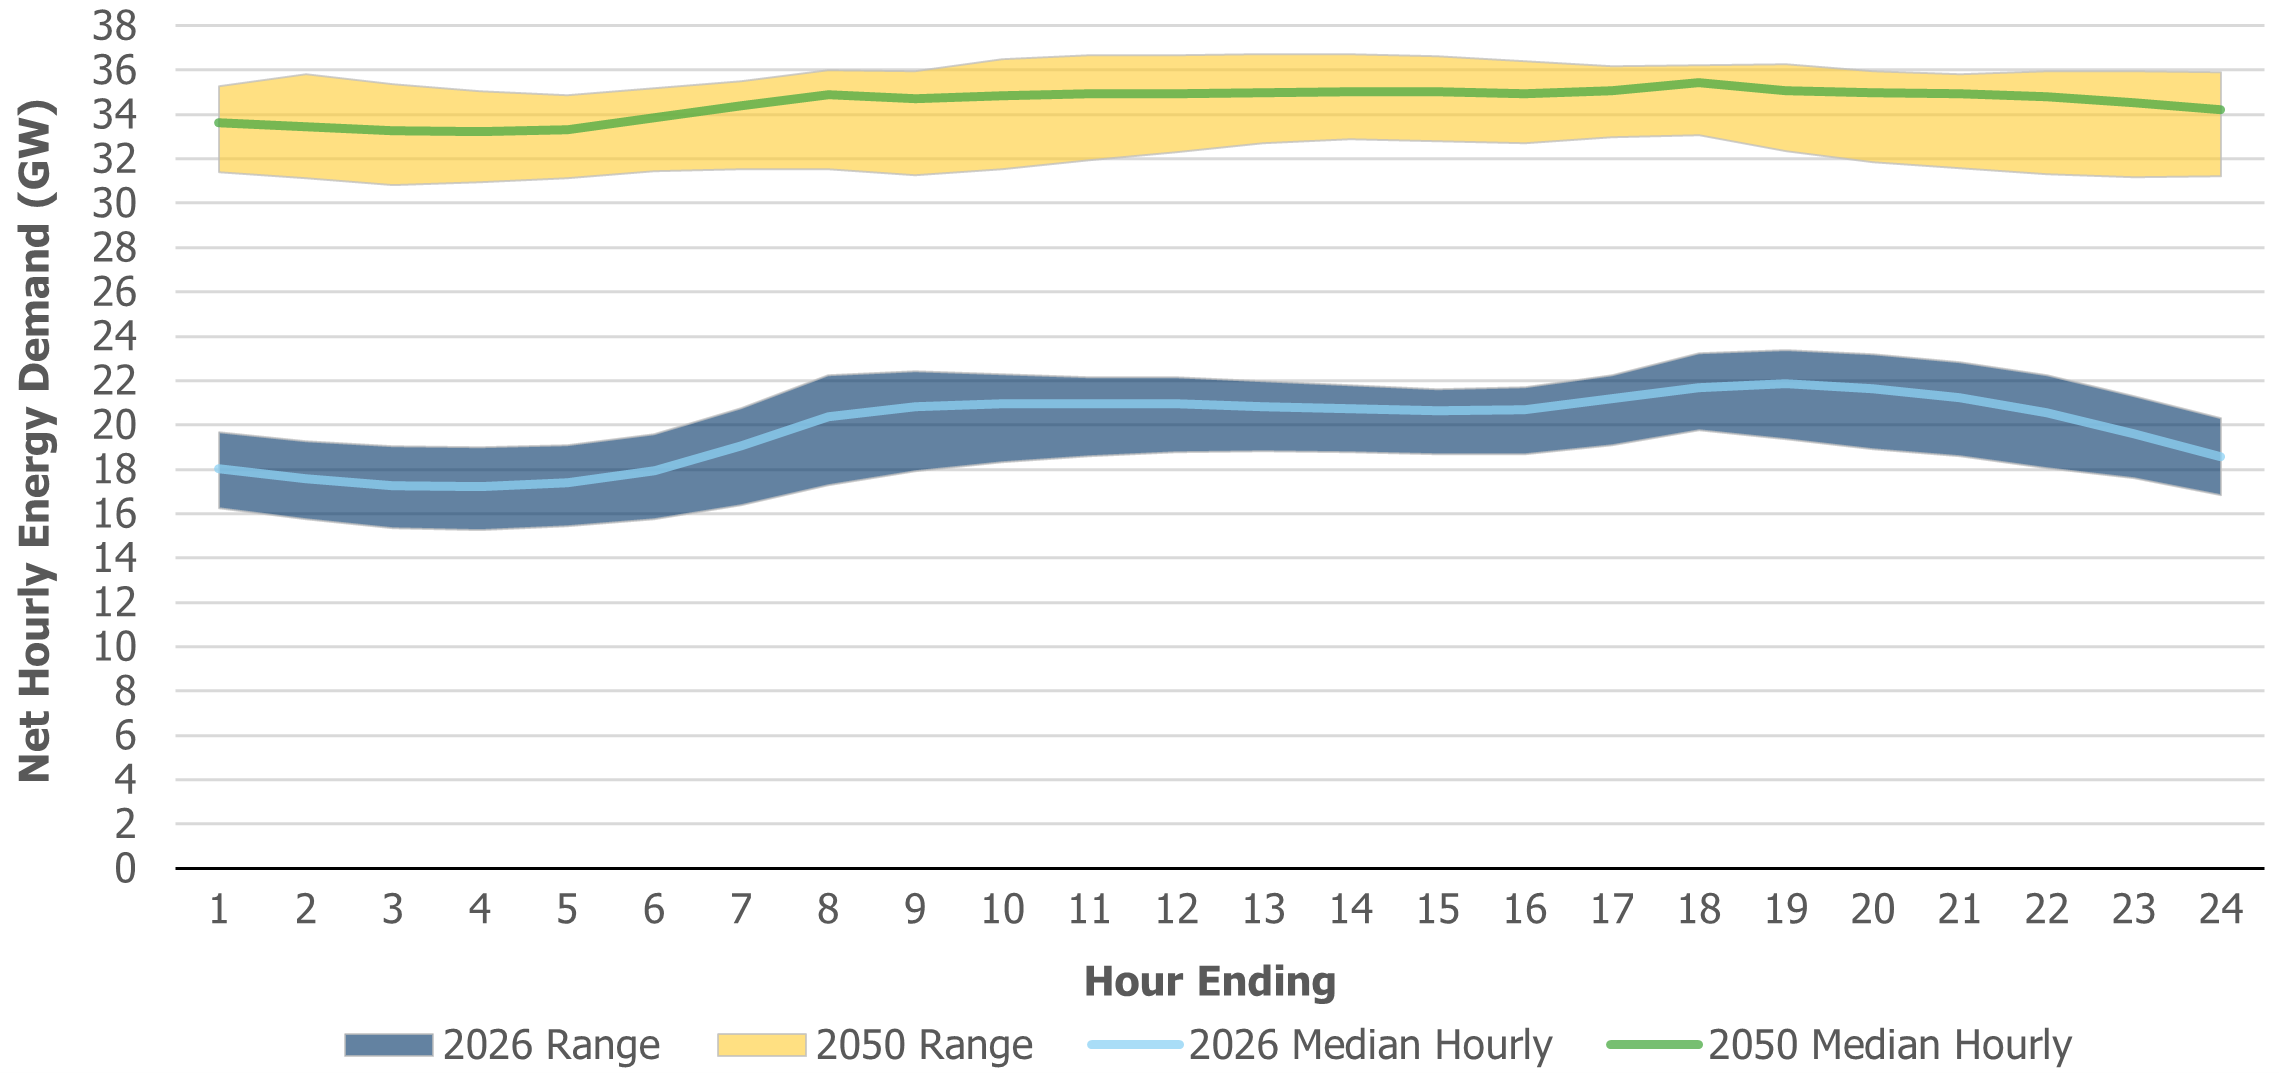
Electricity use is increasing during off-peak hours, reinforcing the need for more baseload power
When and why electricity is used is changing the shape of the daily demand curve.
With more electric vehicles, electric space heating and cooling, and large commercial data centres, daily load profiles are forecasted to change with heightened demand in the evening to overnight periods flattening daily load profiles. Increasing consistent and steady baseload supply like nuclear and hydroelectric will be required to meet system needs.
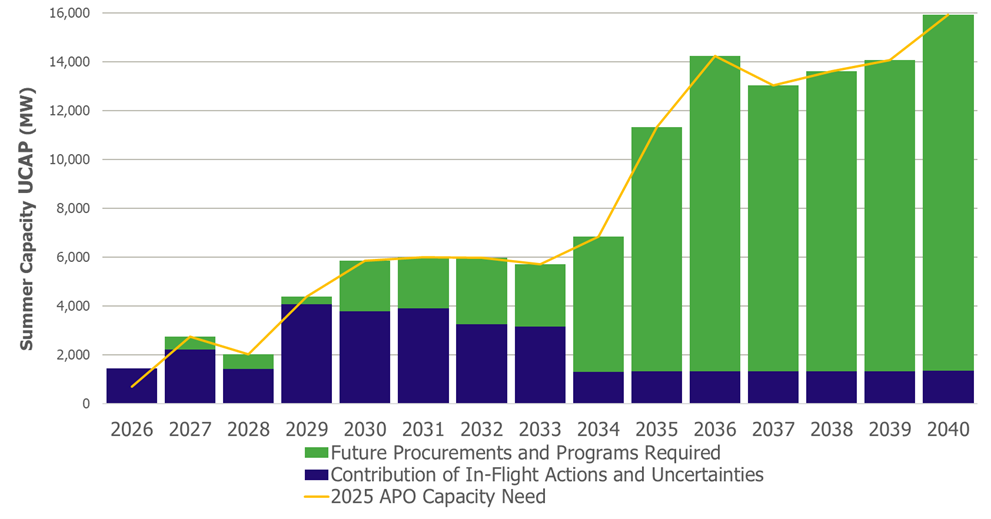
The IESO is taking action to secure future capacity…
To secure capacity as needs emerge over the next decade the IESO is conducting long-term procurements to acquire new capacity resources and is considering a separate procurement to acquire long lead time resources that can be in service by the mid-2030s, which could include both long lead time long duration energy storage and new hydroelectric generation; undertaking medium-term procurements to competitively reacquire existing resources that are coming off contract; and running annual Capacity Auctions in the near term to balance changes in reliability needs in the short term.
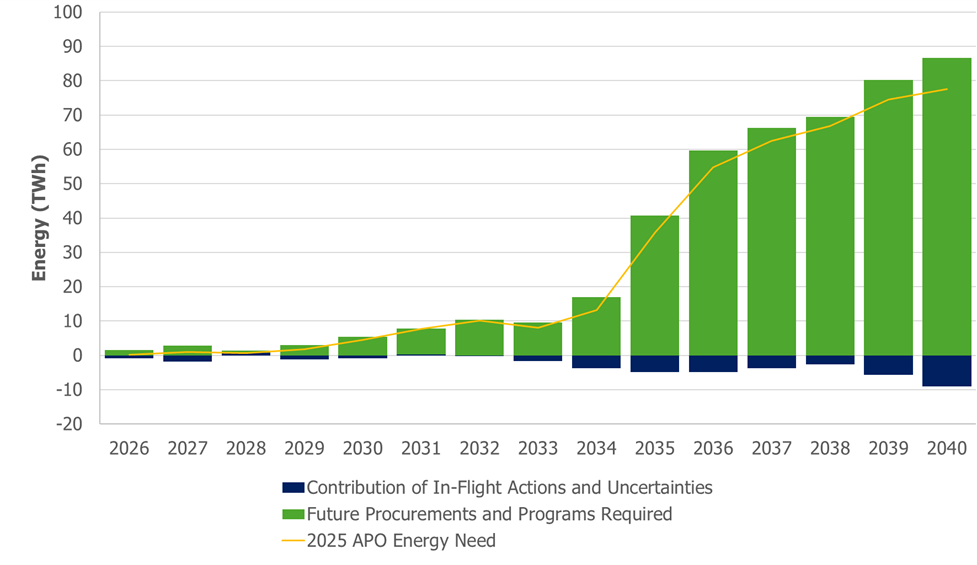
… as well as energy-producing resources.
While the first long-term and medium-term procurements focused largely on capacity to meet demand during system peak hours, a need for more overall energy production emerges in the 2030s. The IESO’s second Long-Term Request for Proposals (LT2 RFP) looks to address these needs by acquiring new supply from wind, solar, hydro and biofuel generation — to meet electricity needs out to 2035.
Future supply decisions beyond 2035 are required to ensure that Ontario’s grid grows alongside the economy and demand, and the IESO has begun working with the sector to determine additional solutions to meet growing needs in addition to mechanisms found in the Resource Adequacy Framework.
Energy efficiency continues to be a valuable and reliable resource
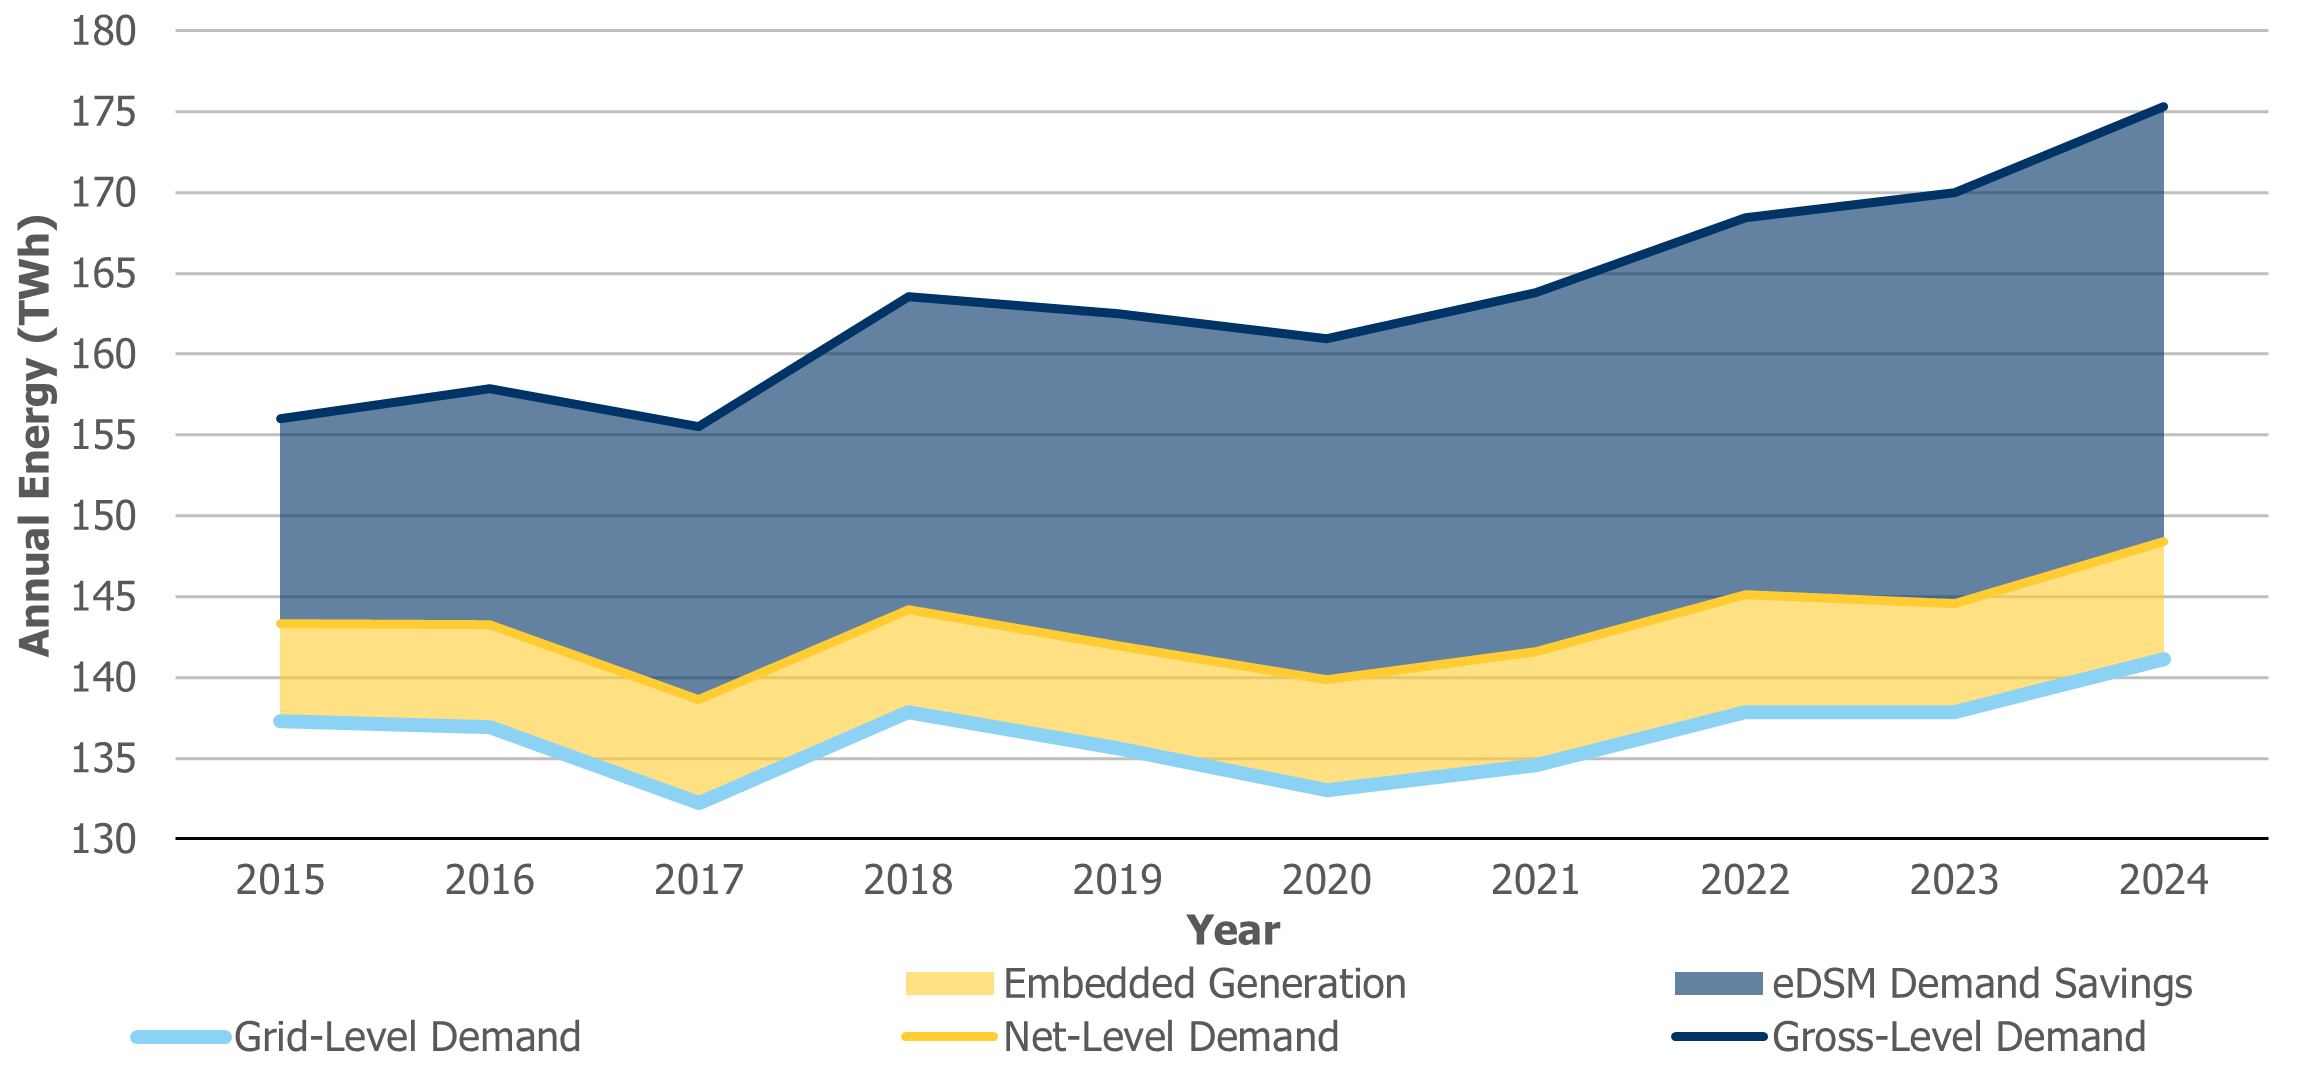
Energy efficiency delivered through demand-side management maintains a reliable, affordable, and sustainable electricity system.
While grid-level demand over the last 10 years has been mostly flat, demand-side management savings have grown from approximately 13 TWh in 2015 to as much as 27 TWh in 2024.
Looking ahead, annual electricity savings via energy efficiency programs and regulations are forecasted to save as much as 35 TWh annually by 2050, and does not include increased savings expected under new programs and incentives that were introduced via the 12-year electricity Demand-Side Management Framework announced in January 2025. Higher savings from the new framework will be reflected in future APOs.
The environmental and cost projections when modelling a future grid
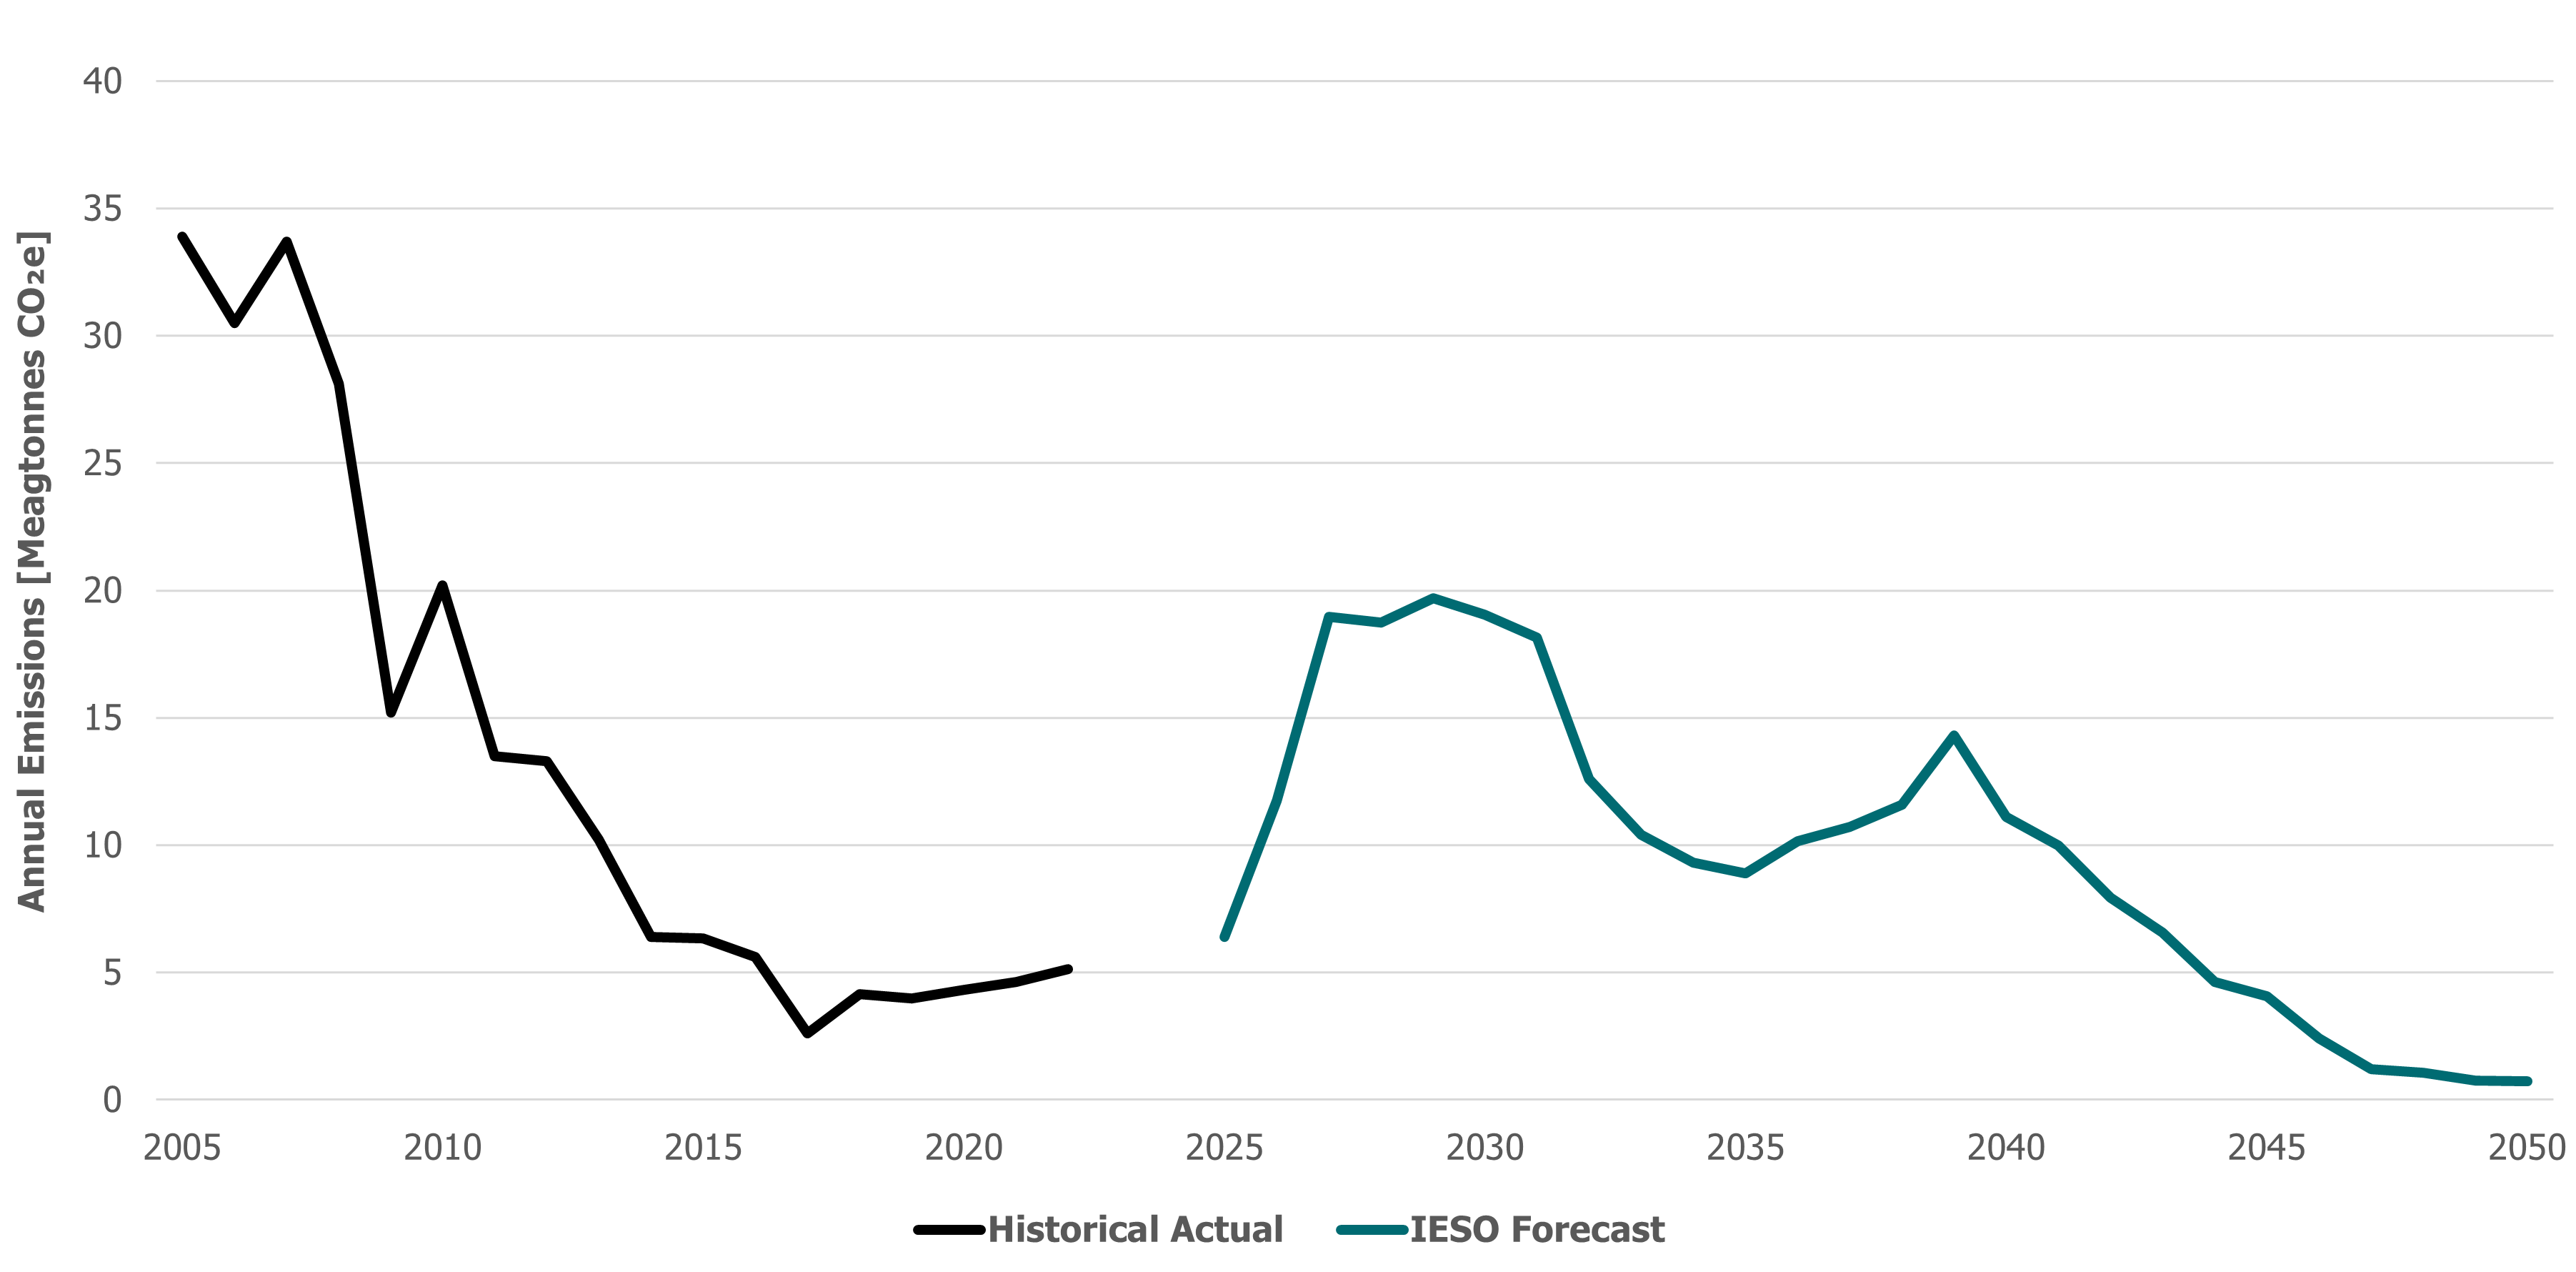
To complement the Annual Planning Outlook, the IESO assessed a theoretical supply mix that could meet future system needs out to 2050. With affordability and reliability criteria as key drivers, the resulting combination of resources reaffirmed the importance of a diverse supply mix capable of meeting demand.
Through scenario modelling, the IESO’s forecasted future supply mix could have the electricity grid reach near-zero emissions by 2050 as gas generation is almost entirely displaced by lower-cost, non-emitting supply: a significant amount of new and refurbished nuclear, storage, and renewables.
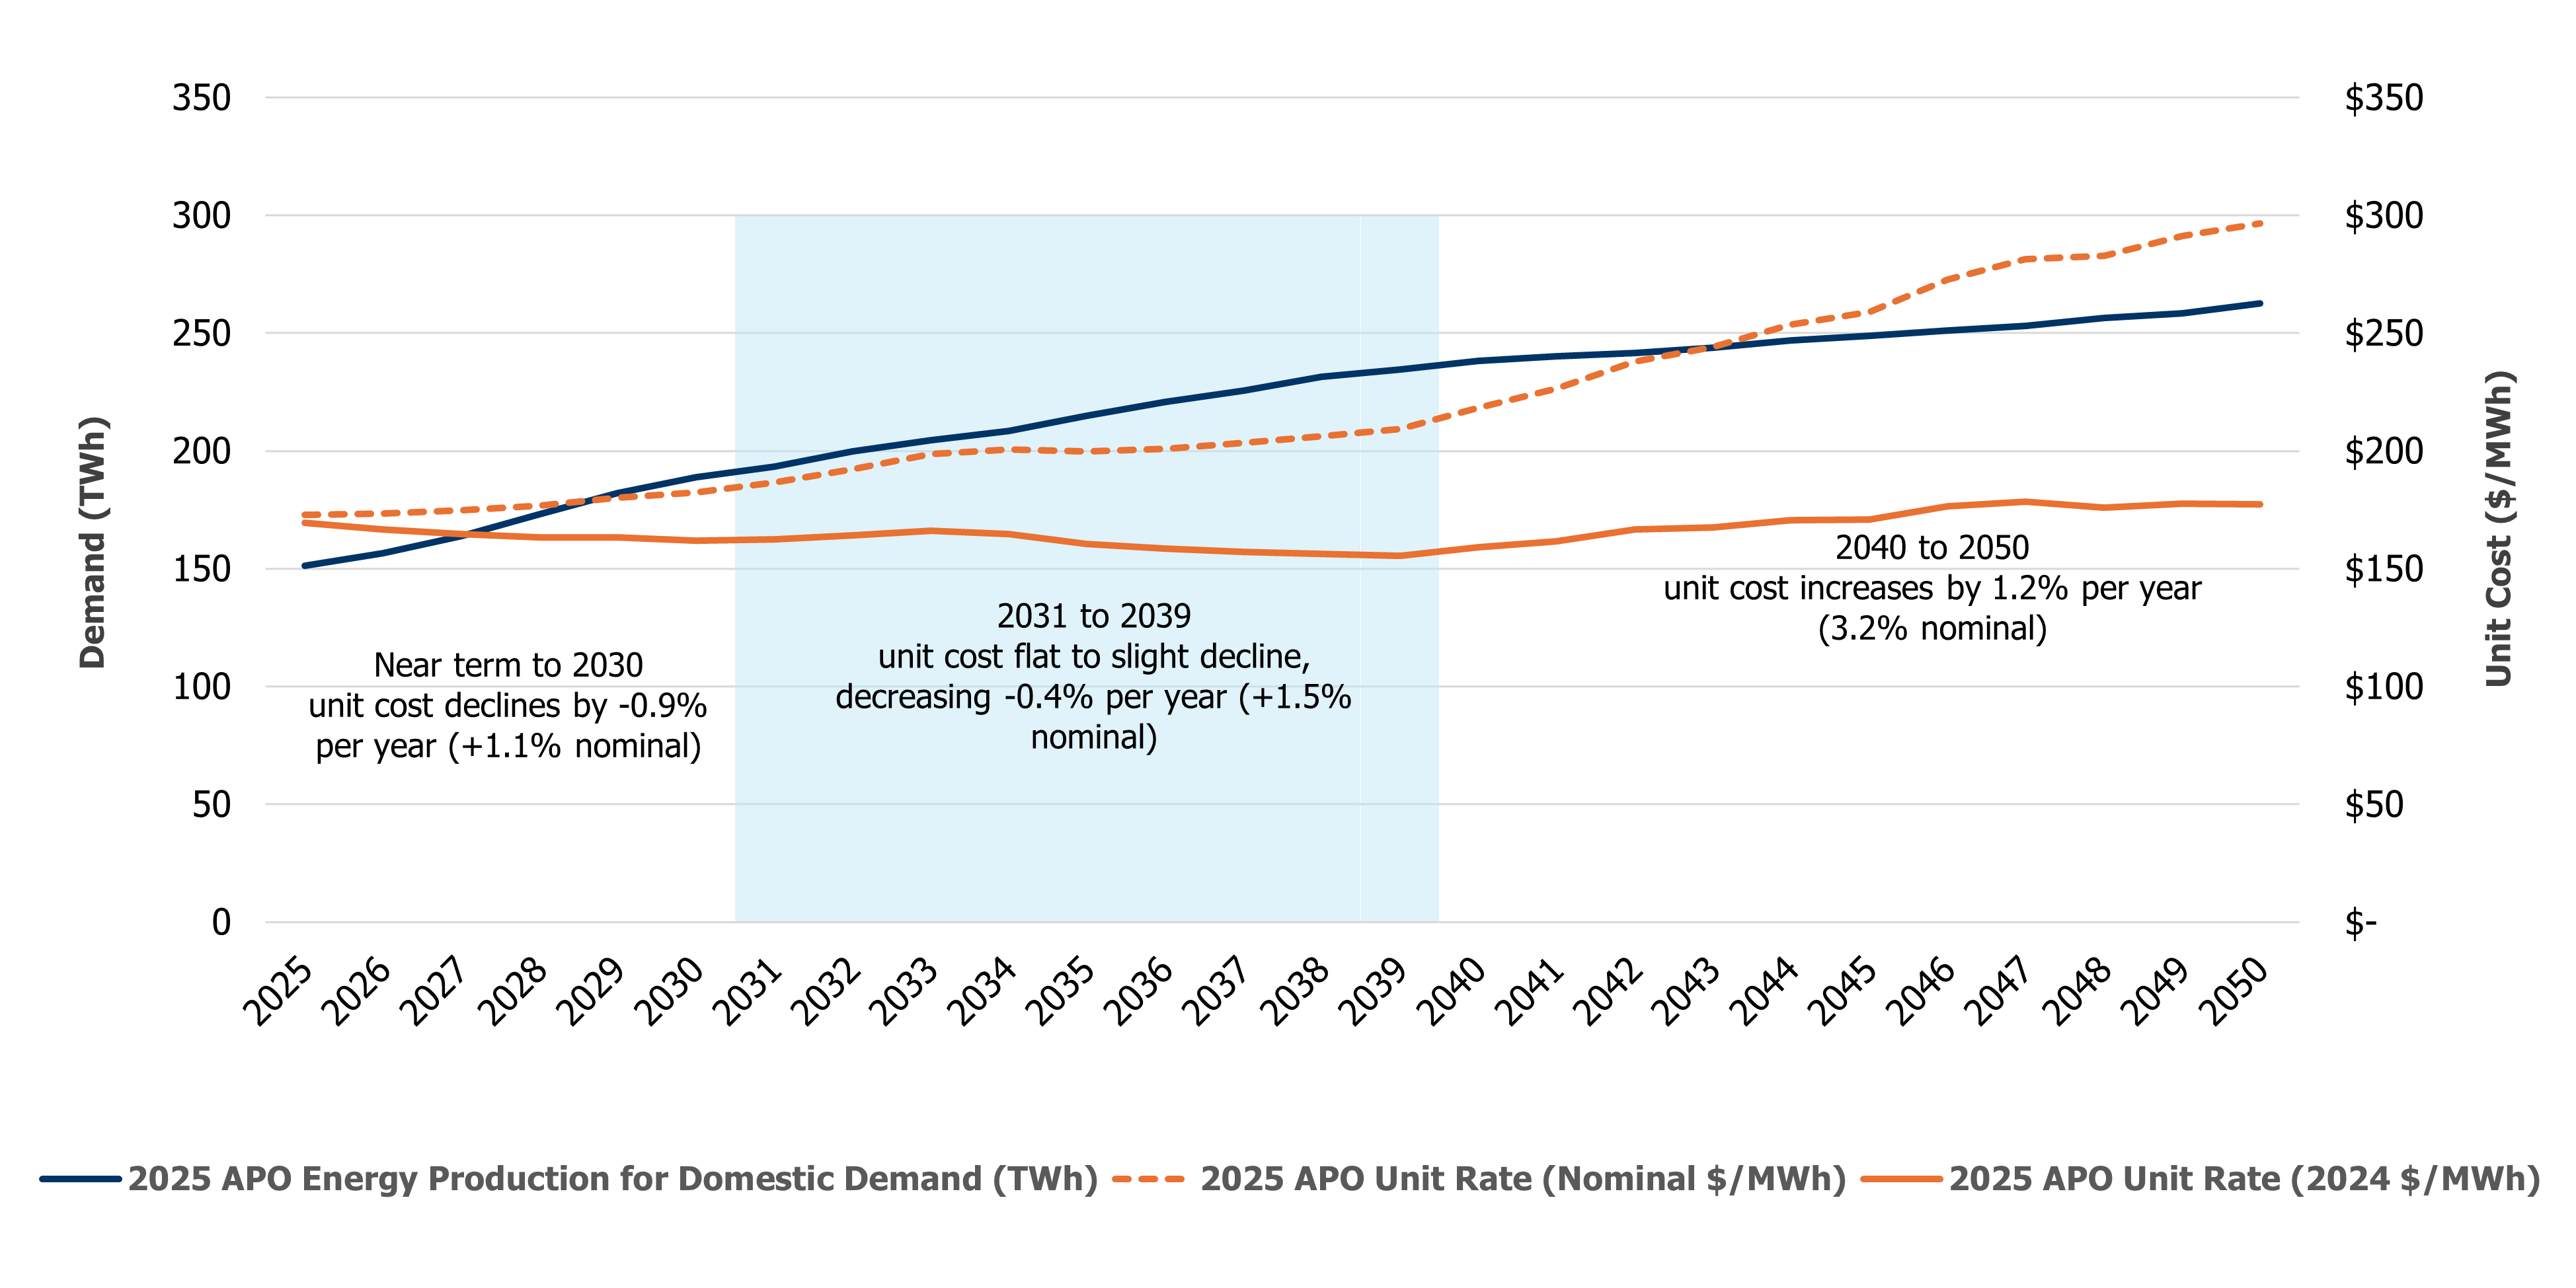
As investments are made to significantly build out the grid to meet future demand, ratepayer costs are expected to remain largely contained. In this scenario, while energy production and total system costs increase to meet growing demand, the per-unit cost of electricity is expected to decline in the near term, remain flat through the 2030s, before increasing slightly in the 2040s. In real terms (2024 dollars), costs begin at $170 per megawatt-hour in 2025, dipping to $155 per MWh in 2039, before reaching $177 per MWh in 2050.
A robust transmission build-out will support new customers and supply
With capacity and energy needs forecast to increase in the planning horizon, a robust transmission system will play an increasingly critical role in connecting new customers and ensuring deliverability of resources to supply forecasted customer demand provincially and locally.
Plans over the next few years will consider investments to maintain reliability to support growth and electrification; enable connection of off-grid First Nations and new large industrial customers; and unlock additional development potential, including more nuclear, long-duration energy storage, hydroelectricity, and new resources acquired through long-term procurements.